Jacinta Das
A. In the video, “First steps in computer vision”, Laurence Moroney introduces us to the Fashion MNIST data set and uses it to train a neural network in order to teach a computer how to see. One of the first steps towards this goal is splitting the data into two groups, a set of training images and labels and a set of test images and labels. Why is this done? What is the purpose of splitting the data into a training set and a test set?
Programmers split data into a training set and a test set because they need data to train their model on - that is, the training data is the data that the model uses for its machine learning. Programmers also want to be able to test their model on data that it has never seen before. If it can accurately label/classify/predict for data it has never seen before, then it has learned successfully. For example, if you wanted to teach someone what a shoe is, then you could get out a bunch of shoes and show them. However, in order to test them on the concept of a shoe, you would want to take a shoe that you haven’t already shown them; if you had shown it to them already, you’ve already told them that that particular object is a shoe. If the person can identify that an object they haven’t seen before is a shoe, then they’ve learned what a shoe is. The same idea is behind training and test sets.
B. The fashion MNIST example has increased the number of layers in our neural network from 1 in the past example, now to 3. The last two are Dense layers that have activation arguments using the relu and softmax funtions. What is the purpose of each of these functions? Also, why are there 10 neurons in the third and last layer in the neural network?
The second layer is a Dense layer with 128 neurons and a relu function in the activation argument. The relu function ensures that the output of a neuron is greater than or equal to zero, so that negative outputs don’t skew results. The last layer is a Dense layer with ten neurons and a softmax function in the activaton argument. There are ten neurons in the last layer because there are ten different types of clothing in the dataset; the job of each of these neurons is to calculate the probability that a piece of clothing is that particular type. The softmax function sets the neuron with the largest probability to 1 and the rest to 0, so the object is classified as one type of clothing.
C. In the past example, we used the optimizer and loss function, while in this one we are using the function adam in the optimizer argument and sparse_categorical-crossentropy for the loss argument. How do the optimizer and loss functions operate to produce model parameters within the model.compile() function?
D. Using the mnist drawings dataset, answer the following questions:
1. What is the shape of the images training set (how many and the dimension of each)?
There are 60,000 images in the training set, and the dimension of each image is 28 by 28 pixels.
2. What is the length of the labels training set?
The length of the labels training set is 60,000; each label corresponds to an image.
3. What is the shape of the images test set?
There are 10,000 images in the test set. The dimension of each image is 28 by 28 pixels.
4. Estimate a probability model and apply it to the test set in order to produce the array of probabilities that a randomly selected image is each of the possible numeric outcomes (look towards the end of the basic image classification exercises for how to do this - you can apply the same method applied to the Fashion MNIST dataset but now apply it to the hand written letters MNIST dataset.)
5. Use np.argmax() with your predictions object to return the numeral with the highest probability from the test labels dataset.
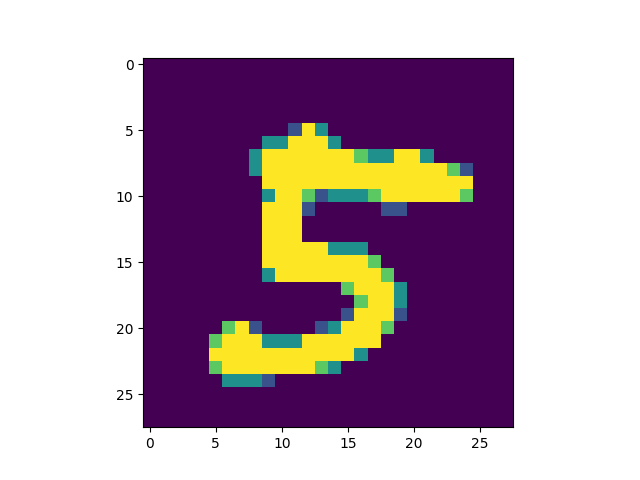
I got a numeral of 5.
6. Produce a plot of your selected image and the accompanying histogram that illustrates the probability of that image being the selected number.

array([5.4007878e-09, 1.3414155e-11, 1.7001489e-10, 4.1967865e-05,3.1919257e-12, 9.9995732e-01, 7.3873497e-14, 8.1238278e-09,6.7425572e-07, 5.4351094e-08], dtype=float32)
