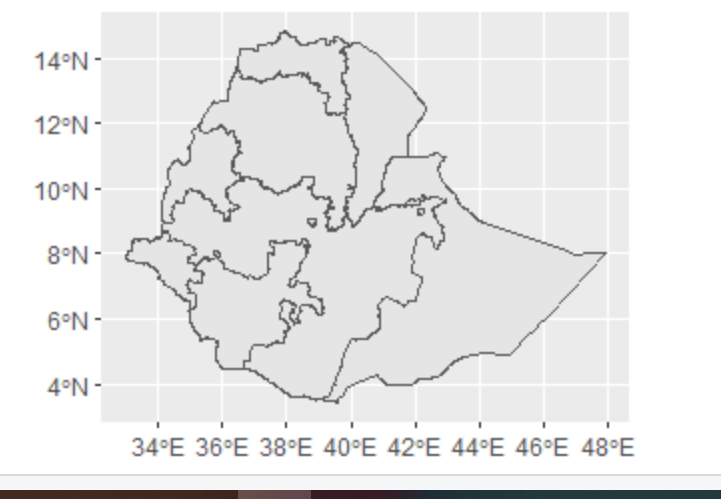
Download the administrative subdivision. Below is a plot of my country, Ethiopia, using the admin data.
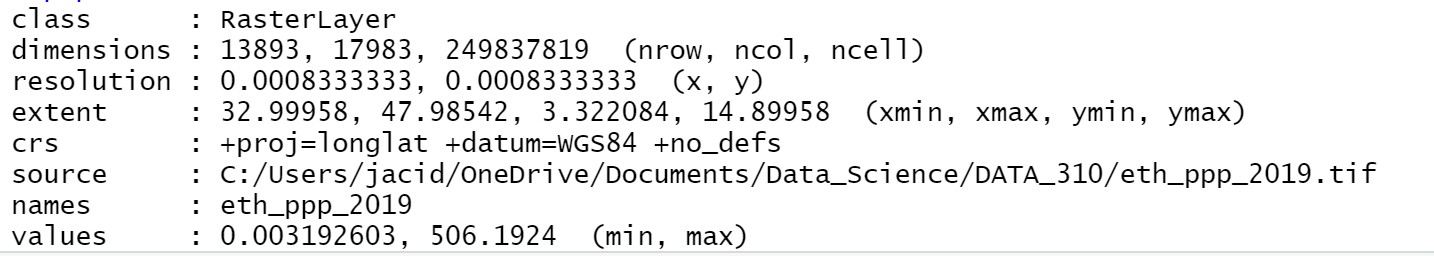
Download the population raster from Worldpop.
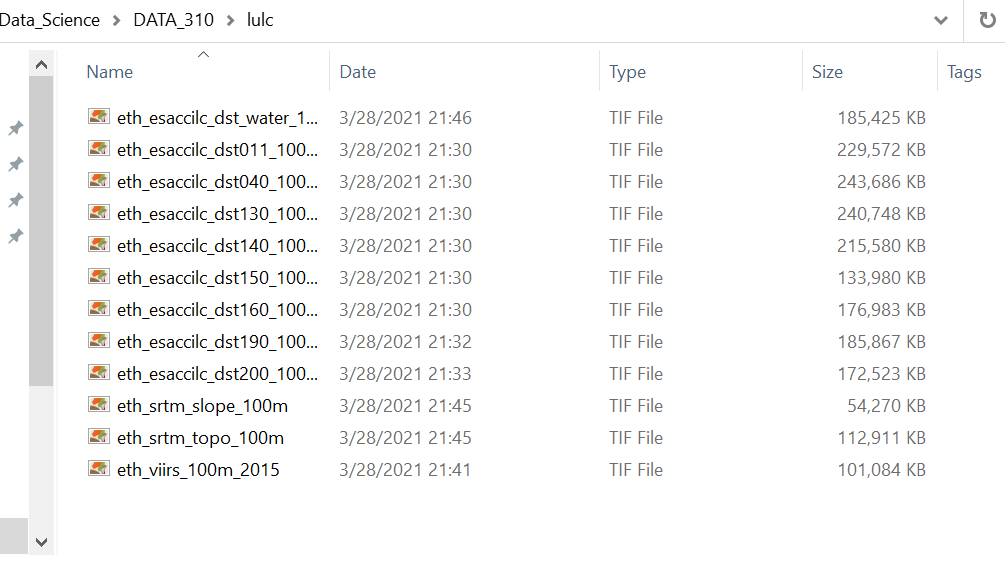
Download the 12 rasters and stack them.
Produce a raster stack and calculate summary stats using the script posted to our slack channel. Below is the link to the csv I produced using the script posted to our slack channel.
Lulc_adm3